
Are you puzzled by the concept of the short run supply curve in economics? You’re not alone.
Understanding this curve is crucial for anyone looking to grasp how businesses decide on the quantity of goods to produce in the short term. This article will guide you through the process step-by-step, making it easy for you to understand and apply this knowledge.
Imagine having the power to predict how changes in production costs affect supply, giving you an edge in your studies or business decisions. By the end of this read, you’ll have a clear understanding of how to find the short run supply curve, empowering you to make informed decisions with confidence. Let’s dive in and unlock this essential economic concept together.
Basics Of Supply Curves
The basics of supply curves are foundational for anyone keen to understand market dynamics. Whether you’re a student of economics or a business owner trying to navigate price fluctuations, knowing how supply curves operate is crucial. These curves illustrate the relationship between price levels and the quantity of goods producers are willing to supply. Understanding this can help you predict changes and make informed decisions.
Definition And Importance
Supply curves graphically represent how much of a good or service is available at various price points. They typically slope upwards, indicating that higher prices incentivize producers to supply more. Grasping this concept is key to anticipating market behavior. Imagine you’re a farmer deciding how much wheat to sell. Knowing your supply curve helps you determine the optimal price to maximize your profits.
Why is this important? Supply curves are fundamental in economics because they help explain how markets reach equilibrium. Knowing this allows you to adjust your strategies based on expected price changes. It’s not just about theory; it’s about applying this knowledge to real-world scenarios.
Types Of Supply Curves
Supply curves come in various forms, each reflecting different market conditions. The most common type is the short run supply curve, which considers factors like fixed production capacity and current resource availability. If you’re manufacturing goods, this curve helps you understand how output changes in response to price shifts, given your current constraints.
Another type is the long run supply curve. Unlike the short run version, this curve assumes that all inputs can be varied. It reflects the potential for expansion and innovation. If you’re planning to grow your business, knowing how your long run supply curve behaves can guide your investment decisions.
Understanding these types of curves can transform how you approach market strategies. Are you considering expanding your production? Analyze your long run supply curve. Are you dealing with immediate resource limitations? Your short run supply curve holds the answers. Exploring these curves can sharpen your competitive edge.
Short Run Supply Curve Fundamentals
The short run supply curve is a vital concept in economics. It helps businesses understand how they can adjust supply over a limited period. In this phase, some inputs are fixed, while others are variable. This understanding allows businesses to make informed decisions on production and pricing.
Characteristics Of Short Run
In the short run, certain inputs remain unchanged. This could include capital like machinery or facilities. Businesses cannot easily adjust these due to time or cost constraints. Only variable inputs can change, such as labor or raw materials. The short run is about optimizing these variable inputs to meet demand. It’s crucial for managing costs and maximizing profits.
Role Of Fixed And Variable Inputs
Fixed inputs do not change in the short run. They are the backbone of production, providing stability. Variable inputs, on the other hand, offer flexibility. Businesses adjust these to respond to market changes. For example, increasing labor to produce more goods when demand rises. Understanding this dynamic helps in planning and resource allocation. It ensures businesses remain competitive and efficient.
Cost Structures And Supply
Understanding how cost structures affect supply is crucial in economics. It helps businesses determine production levels and pricing strategies. Costs can be divided into fixed and variable types. Both play a role in shaping the supply curve.
Understanding Fixed Costs
Fixed costs remain constant regardless of production volume. Rent, salaries, and equipment are common examples. These costs do not change even if production increases or decreases. Fixed costs create a baseline expense for businesses. They must be covered before profits can be realized.
Businesses often face fixed costs in the short run. Knowing these costs helps in planning and budgeting. They are key to understanding the supply curve. Fixed costs influence decisions on expanding or reducing production. Proper management ensures stability in financial planning.
Variable Costs And Their Impact
Variable costs fluctuate with production levels. Raw materials and utilities are typical examples. As production increases, variable costs rise. They directly affect the supply curve by altering production decisions. Businesses must balance these costs to optimize profitability.
Understanding variable costs helps in pricing and output decisions. They are crucial in determining the supply curve’s slope. When variable costs increase, supply may decrease. This is due to higher production expenses. Efficient management of variable costs can enhance competitiveness. Businesses can adjust strategies based on these costs.
Deriving The Short Run Supply Curve
Understanding how to derive the short run supply curve is essential. This curve shows how much a firm is willing to produce at different prices. It is crucial for analyzing market behavior and predicting changes. The short run supply curve is based on the firm’s costs and production capacity.
Marginal Cost And Supply Curve
The marginal cost is key in supply curve derivation. It represents the cost of producing one more unit. As production increases, marginal cost usually rises. This happens due to the law of diminishing returns. The supply curve follows the upward slope of the marginal cost curve.
Steps In Curve Derivation
First, identify the firm’s variable costs. These change with the level of output. Next, calculate the marginal cost for each output level. This requires dividing the change in total cost by the change in output. Plot these points on a graph. The upward-sloping part of the marginal cost curve becomes the supply curve. Ensure to start from the point where price equals average variable cost. This ensures the firm covers its variable costs.
Factors Influencing Short Run Supply
Understanding factors like production costs and technology is key to finding the short run supply curve. Analyze how these elements impact supply decisions to accurately chart the curve. This helps in predicting supply responses in changing market conditions.
Factors Influencing Short Run Supply Understanding the short run supply curve involves various factors. These factors can shift the curve, affecting supply levels. Each factor plays a unique role. Let’s explore them in detail.Input Prices
Input prices directly impact the short run supply. If input costs rise, production becomes expensive. Firms may supply less at the same price. Conversely, if input prices fall, supply might increase. Businesses can produce more with lower costs.Technological Changes
Advancements in technology often shift the supply curve. New technology can make production more efficient. This can lead to increased supply. Improved machinery or methods reduce production time. Companies can produce more goods quickly.Government Policies
Government policies also influence supply. Taxes or subsidies can affect production costs. A subsidy might lower production costs, increasing supply. On the other hand, higher taxes can reduce supply. Regulations can either restrict or boost production levels.
Credit: www.youtube.com
Graphical Representation
The graphical representation of the short-run supply curve helps visualize how firms decide on production levels. It combines economic theory with practical decision-making. This section will guide you through plotting and interpreting the curve.
Plotting The Curve
Start by identifying the firm’s marginal cost. This cost influences production decisions. Plot the marginal cost on the graph. The vertical axis represents price levels. The horizontal axis shows quantity produced. As the price increases, firms produce more. This movement forms the supply curve. The curve usually slopes upwards. This indicates higher production at higher prices.
Interpreting Graphs
Understanding these graphs is crucial for economic analysis. Look at the slope of the curve. A steep slope means high sensitivity to price changes. Flat slopes indicate less sensitivity. Notice the curve’s position. It reflects overall production capability. Compare the curve at different times. Changes can suggest shifts in production costs or capabilities. Use these insights for better economic decisions.
Common Mistakes And Challenges
Finding the short run supply curve poses challenges such as misunderstanding cost structures or incorrectly identifying equilibrium points. Common mistakes include neglecting fixed costs and overlooking market conditions that affect supply decisions. Accurate analysis requires careful attention to market dynamics and cost variations.
When trying to find the short run supply curve, you might encounter several common mistakes and challenges. These pitfalls can lead to incorrect conclusions and potentially costly decisions. It’s crucial to identify and understand these errors to improve your analysis and strategy.Misinterpretation Of Costs
Misinterpreting costs is a frequent error when determining the short run supply curve. Many people confuse fixed and variable costs, leading to inaccurate calculations. Fixed costs remain constant regardless of production levels, while variable costs change with output. A practical tip is to clearly differentiate between these costs before analysis. Consider creating a simple table to categorize costs accurately. This approach ensures a clear understanding of what affects your supply decisions.Ignoring External Factors
Another common challenge is overlooking external factors that influence supply. Factors like market trends, regulations, and competitors can significantly impact your supply curve. Ignoring these elements can lead to unexpected shifts in supply and demand. Stay informed about industry changes and consider their potential effects. Engaging with industry news and networking can provide valuable insights. Ask yourself, are you considering all the variables that could alter your supply curve? Recognizing these mistakes and challenges can refine your approach to finding the short run supply curve. Being proactive in addressing them can lead to more accurate and strategic decisions.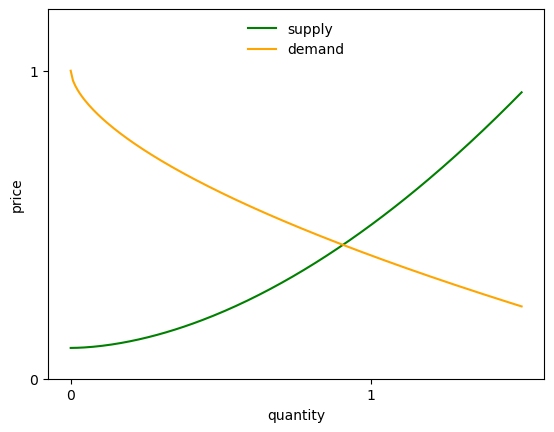
Credit: intro.quantecon.org
Practical Applications
Understanding the short run supply curve offers valuable insights. It helps businesses make informed production decisions. By analyzing this curve, companies can predict changes in supply. This prediction aids in adjusting to market demands efficiently. Practical applications of the short run supply curve span various industries. These applications provide a deeper understanding of production dynamics.
Real-world Examples
Consider a bakery adjusting its bread production. With wheat prices rising, the short run supply curve helps forecast costs. This forecast allows the bakery to adjust prices. Another example is a car manufacturer facing a sudden steel shortage. The short run supply curve aids in deciding production levels. It helps in understanding the impact on supply and pricing.
Industry Specific Analysis
In agriculture, the short run supply curve is crucial. Farmers use it to plan crop production based on weather forecasts. It helps them decide the quantity to plant. In the tech industry, semiconductor manufacturers analyze short run supply. This analysis helps them respond to raw material fluctuations. Understanding these dynamics ensures better resource allocation. Businesses in retail use it to manage stock levels. By predicting supply shifts, they can optimize inventory. This minimizes waste and maximizes profit.

Credit: quizlet.com
Frequently Asked Questions
What Is The Supply Curve In Short Run?
The short-run supply curve shows the relationship between price and quantity supplied, considering fixed inputs. It typically slopes upward, indicating that higher prices incentivize producers to supply more. In the short run, some factors are fixed, affecting how firms respond to price changes.
How To Graph A Short Run Supply Curve?
To graph a short run supply curve, plot price on the vertical axis and quantity on the horizontal axis. Illustrate the curve upward sloping from left to right, reflecting increasing costs and prices. This represents producers supplying more as prices rise, capturing the short-term economic scenario.
What Does A Short Run Supply Curve Look Like?
A short run supply curve typically slopes upward. It reflects how producers increase output in response to higher prices. As prices rise, firms can cover higher production costs, motivating increased supply. This curve is usually steeper due to short-term constraints like fixed resources and technology.
How Do You Calculate The Supply Curve?
To calculate the supply curve, plot quantity supplied against price. The curve typically slopes upward, reflecting higher prices leading to increased supply. Use data points to determine the relationship between price changes and quantity changes, resulting in a graphical representation of supply dynamics in the market.
Conclusion
Understanding the short run supply curve is essential. This curve shows how firms respond to price changes. It helps in predicting production levels. Also, it aids in decision-making for businesses. Economists use it to study market behaviors. With this guide, grasp these concepts better.
Apply them to real-world scenarios. Enhance your economic knowledge. Gain insights into market dynamics. Strengthen your analytical skills. Use this understanding to make informed choices. Remember, practice improves comprehension. Keep exploring economic principles. Stay curious and learn continuously.